

Background
During first half of year 2021, client’s in-house inspection team raised a major concern regarding suspected leakage & corrosion activities in 16” buried pipeline under concrete flooring in their premises.
Maintenance contractor approached Blue Horizon Services & Oil Field Maintenance LLC in Abu Dhabi, an Arise Global group company, to help them detect the pipeline corrosion and leakage & corrosion defects and their locations for maintenance/ repair.
Job Overview
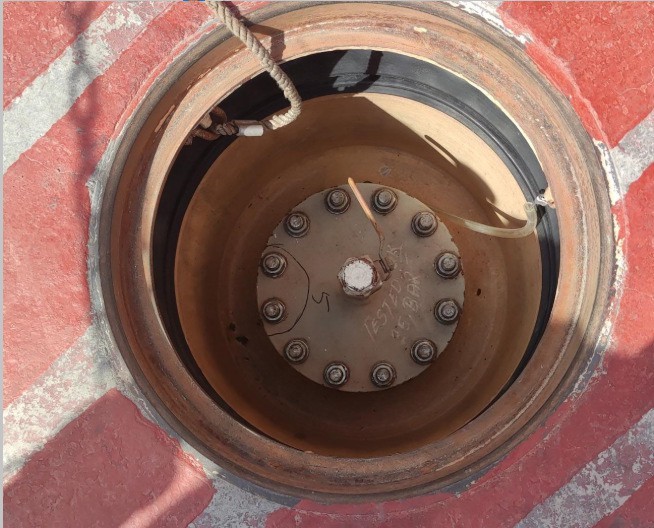
Our engineers visited the site for available access points to the buried pipeline and proposed non-invasive acoustic emission inspection.
It was the second Acoustic Emission Testing of buried pipeline, first similar inspection carried out in year 2018.
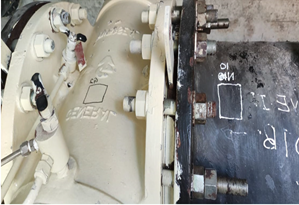
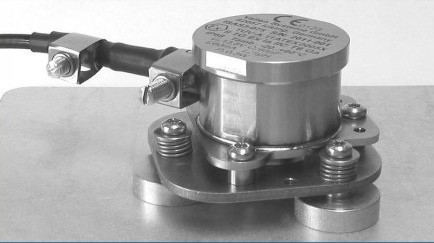
- The inspection was carried out by mounting AE sensors at the access points along the buried pipeline.
- Pressurised test Nitrogen gas was fed from valve station according to the ASTM/ASME standards and the data was collected for analysis.
- The data was analysed to detect the leakage & corrosion activities and reported with confirmed location of a leak and other locations for corrosion and suspected valve passing.
| Buried Pipeline Information | |
| Length | 363 Meters (Appx.) |
| Outside Dia. | 406mm |
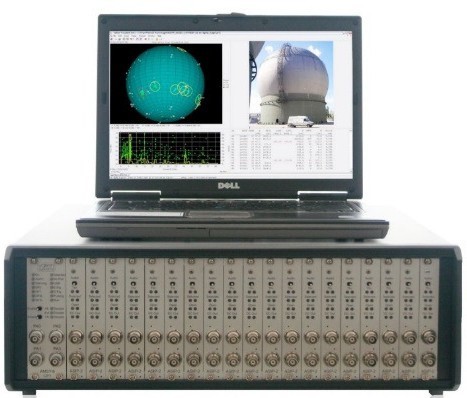
Testing Equipment Details
AE Inspection Results Analysis and Discussion
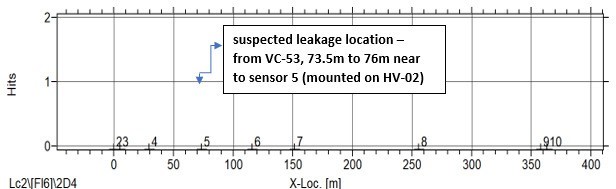
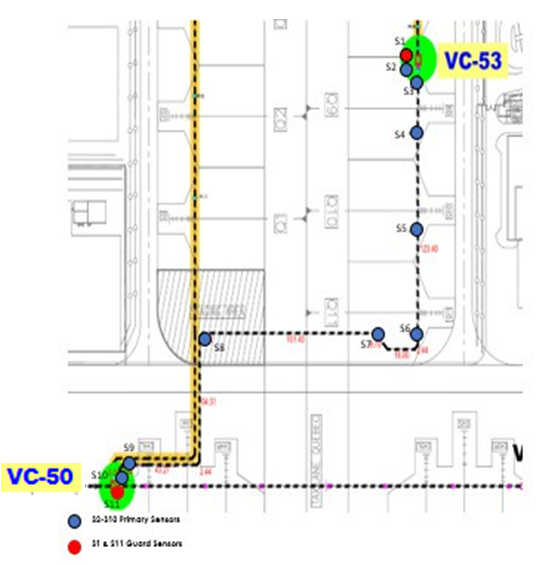
As per the acoustic emission inspection data analysis, suspect leakage location was found between 73.5m to 76m from Valve Chamber (VC) 53(mounted on HV-02) and was reported to client
The acoustic emission inspection and result reporting duration took just 1 week, without any site excavation from client side due to non-invasive and volume inspection nature of acoustic emission technology employed.
The inspection was carried out with nearby parking bays in operation which caused high ambient noise of aircraft engines (while arriving and departing from parking bays), however due to advance analytical techniques employed by our analyst engineers, this noise was effectively filtered to find the leakage location.
In-house analysis was carried out in both the Time and Frequency domain.
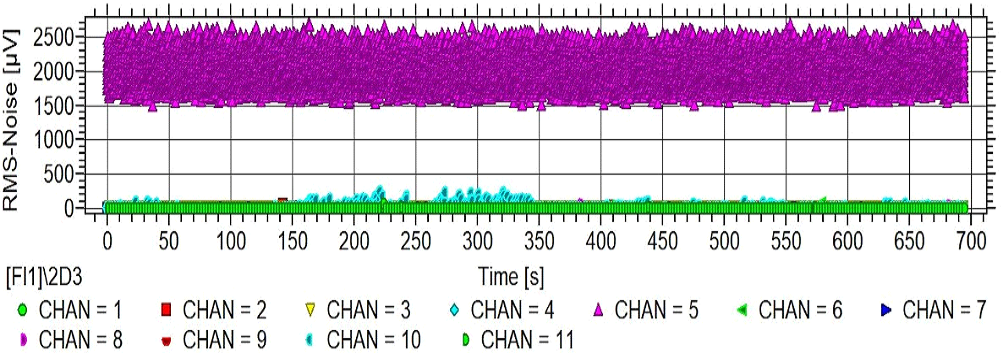
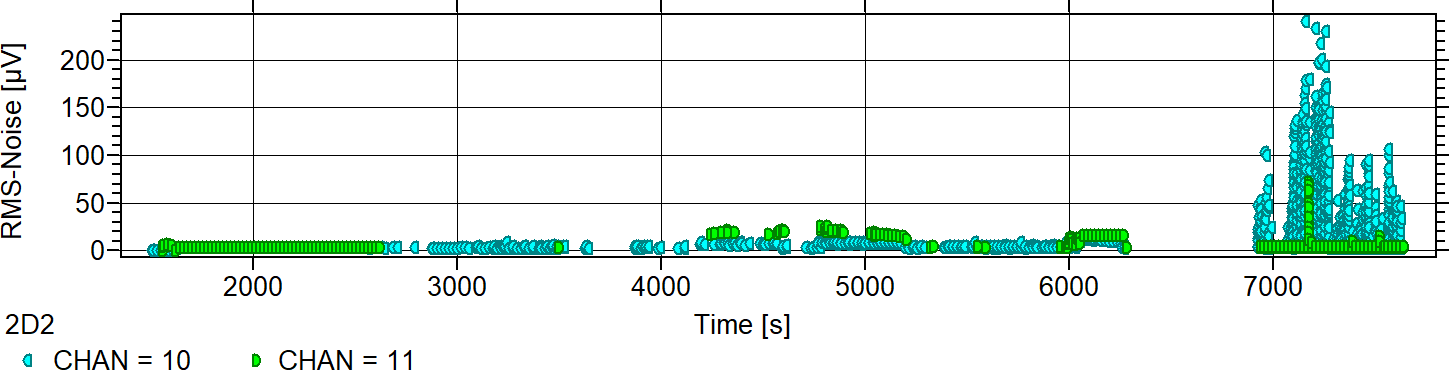
Figure A & B: DEFECT ACTIVITIES NEAR EACH CHANNEL
The above graphs indicate the response from each sensor with respect to the time. As shown, the Acoustic Emission activities from the sensor 5 (CHAN =5) are higher, that clearly indicates the presence of defect near that sensor location. When closely analysing the signals,
- The suspect leakage location was found to be between 73.5m to 76m in the pipeline from Valve Chamber (VC) 53.
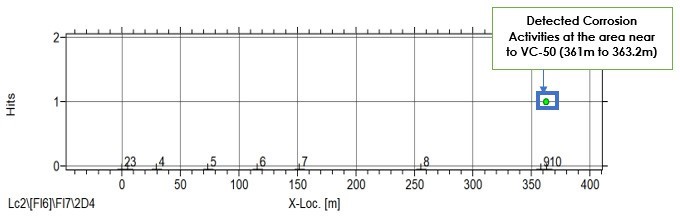
- The corrosion activities were found at the area near to Valve Chamber (VC) 50.
- The suspected valve passing/ leakage activities was found at Valve Chamber (VC) 50.